Courses

Energy Implications for Standard of Living

Energy is a necessity for our everyday lives, and has a great impact on our standard of living and economic growth. The United States alone, one of the most energy efficient countries globally, consumes 90 quadrillion BTU per year, with a population of 330 million people. If we burned all of that energy by driving cars alone, every person in the country would have to drive 150 miles every day for 7 to 8 hours at an average speed of 20 to 25 miles per hour! 

In an effort to truly recognize energy constraints around the world let’s use this analogy of per capita energy consumption for the sole purpose of driving a car as illustrated below. A car is a proxy for an American’s energy consumption.

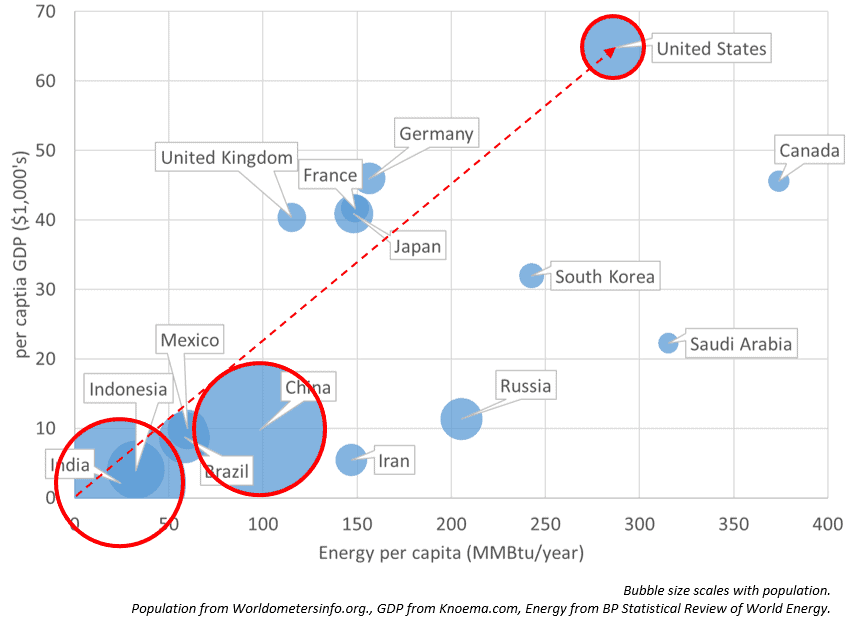
How does an American’s energy consumption compare to that of citizens of other countries? Let’s consider people living in China and India.  Do citizens of these countries have enough energy available to them to drive around in a car 150 miles a day like an American? Think about what you may know about population and energy consumption in these countries. Then, click the drop down icons below to see how energy consumption in the United States compares to China and India. 

China

3 people would have to be driving that same vehicle to share the equivalent amount of energy as a single American. 

Person premium iconPerson premium iconPerson premium icon

India

12 people would have to be driving that same vehicle to share the equivalent amount of energy as a single American. 

Person premium iconPerson premium iconPerson premium iconPerson premium iconPerson premium iconPerson premium iconPerson premium iconPerson premium iconPerson premium iconPerson premium iconPerson premium iconPerson premium icon

Now, you have a visual to help you understand how we live in luxury with regard to our daily energy consumption in the United States. As you saw, 3 citizens in China share the equivalent amount of energy as a single American and in India, 12 citizens share the equivalent amount of energy. Think about it; how much different would everyday life be if your energy consumption was constrained to about 33% or 8% of the energy you currently consume? 

Energy Consumption and Gross Domestic Product

Energy poverty is a prevailing issue in third world countries and most of the world’s population is constrained to low income, low energy per capita areas as shown in the graph below. This graph plots per capita energy consumption in millions of BTUs per year (MMBtu/year) versus per capita Gross Domestic Product (GDP) ($1,000’s), with bubble size scales based on country population. In basic terms, GDP is the market value of all goods and services that are produced within the country during a given time period (annual in this case), and in this case the data are shown per capita to normalize the data. 

Through normalization (presenting the data as ‘per capita’), values of GDP and energy consumption are set to a common scale, without distorting differences in these values simply due to the ranges of country populations. The bubbles are used on the graph to preserve the insight that population data may give in the data display. 

What trends are highlighted by this graph? As you can see from the graph, countries with high per capita GDP also have high values of per capita energy consumption (MMBtu/year), such as the United States, Canada and Germany. Additionally, countries with low per capita energy consumption and low per capita GDP have very large populations, such as China and India. What other trends or outliers (data points that do not fit general trends) do you see in the graph? Can you explain them?

Another method for determining the extent to which energy usage drives standard of living is to calculate per capita $GDP per barrel of oil equivalent (BOE) consumption per year. By definition, “the barrel of oil equivalent (BOE) is a unit of energy based on the approximate energy released by burning one barrel (42 US gallons or 158.9873 litres) of crude oil.”1Barrel of oil equivalent. DBpedia. (n.d.). https://dbpedia.org/page/Barrel_of_oil_equivalent.  Using the equation, $GDP per capita ፥ BOE energy/year you can determine the energy efficiency ranking for each country shown on the graph below. 

As an example, let’s determine what the per capita $GDP per BOE energy consumption is for the United States. 

\[\frac{\$\text{GDP per capita} }{\text{BOE energy} } =\frac{{\$60{,}000}  }{51\  \text{BOE} } =\$1{,}176\]

With the same equation used to calculate per capita $GDP per BOE for United States energy consumption, calculate the per capita $GDP per BOE for the following countries and check your answer below. 
  • Switzerland 
  • Germany 
  • Norway 
  • China 
Switzerland

$3,762 

\[\frac{\$ \text{GDP per capita} }{\text{BOE energy} } =\frac{\$ {79{,} 000} }{21\ \text{BOE} } =\$ 3{,} 762\]

Germany

$1,607 

\[\frac{\$ \text{GDP per capita} }{\text{BOE energy} } =\frac{\$ {45{,} 000} }{28\ \text{BOE} } =\$ 1{,} 607\]

Norway

$1,156 

\[\frac{\$ \text{GDP per capita} }{\text{BOE energy} } =\frac{\$ {74{,} 000} }{64\ \text{BOE} } =\$ 1{,} 762\]

China

$500

\[\frac{\$ \text{GDP per capita} }{\text{BOE energy} } =\frac{\$ {9{,} 000} }{18\ \text{BOE} } =\$ 500\]

Now that we’ve determined per capita $GDP per BOE energy consumption, rank the following countries for energy efficiency (Hint: the larger $GDP per BOE, the more energy efficient). 
  • Norway 
  • Germany 
  • Switzerland 
  • China 
(1) Switzerland (2) Germany (3) Norway (4) China

Correct. 

(1) Germany (2) Switzerland (3) Norway (4) China

Incorrect. 

(1) Norway (2) Germany (3) Switzerland (4) China

Incorrect. 

True or False: The US and Norway are ranked equivalent in regard to energy efficiency. 
True

Correct. 

If you look at the line on the graph, both US and Norway have the same slope, indicating they are equivalently ranked for energy efficiency. 

False

Incorrect.

Oklahoma Academic Standards
TEKS Standards
College Board Units and Topics
Next Generation Science Standards