In this exercise, you will work on a design project and estimate a real-world scenario where geothermal energy is converted to electrical power. By the end of the exercise, you will calculate the power output of a proposed Geothermal Power Plant and the number of homes that could be powered by this plant during peak demand in Texas.
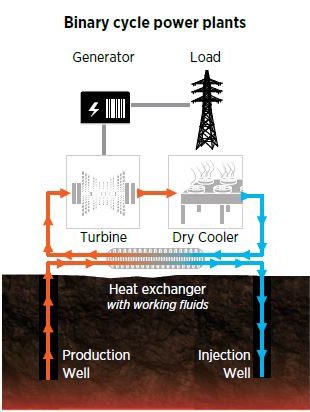
The surface geothermal power plant is a binary cycle power plant.
ERCOT numbers:
The Electric Reliability Council of Texas, the entity tasked with managing the flow of Texas’ power supply provides the following numbers:
- 1 MW of electricity can power about 200 Texas homes during periods of peak demand.1Minton, Lisa, (2020, August). Texas’ Electricity Resources. https://comptroller.texas.gov/economy/fiscal-notes/2020/august/ercot.php
Information and Tools for the Design Project
You will use a spreadsheet available as a google sheet.
This spreadsheet will have three different tabs (located at the bottom of the spreadsheet):
- Calculation Worksheet
to provide a summary of your design project - Water Properties Table
to calculate the thermal energy delivered by the working fluid (water) - Efficiency Estimate Plot
to estimate the efficiency of thermal to electrical energy conversion for the plant
Calculation Worksheet
- You will provide measurements for several cells of the spreadsheet.
- Some values you will provide from the Water Properties Table or the Efficiency Estimate Plot.
- Other numbers will be the results of calculations already set up for certain cells within the spreadsheet.
Geothermal Reservoir and Well Measurements
Consider a geothermal resource with a subsurface reservoir temperature of 160 degrees Celsius. Wells are drilled and geothermal brine (assumed to be water in this exercise) flows at 10,000 liter/hour from the reservoir to the surface. It is estimated that the fluid cools by 10 degrees by the time it arrives at the surface facility. These measurements can be summarized below:
Inputs Measurements
Subsurface Reservoir Temperature:
\[T_{\text{Geothermal Resource}}=160\ \text{°C}\]
Temperature Drop at Surface:
\[\Delta T_{\text{drop} }=10\ \text{°C}\]
Volumetric Flowrate:
\[Q=F_{\text{well}}=10000\ \frac{\text{L} }{\text{hour} }\]
Let’s Walk Through the Exercise
1) Have the google sheet file open.
2) Go to the Calculation Worksheet (first tab) and enter the input parameters given above in the appropriate boxes under the Value column.
3) We have been given the measurements of the flowrate in the volume of fluid flow per time (10,000 L/hr). For our project, we need to calculate the flowrate in units of mass of fluid flow per time (in kg/s).
To make this conversion from volumetric flow to mass flow, you first need the water density (ρ) at the given temperature.
\[\text{density}=\frac{\text{mass}}{\text{volume}}\]
Knowing the water density, we can convert our number from a volume-based number for flow to a mass-based number for flow. Once you look up the water density, the units must be converted to kg/s to find the injection mass flow rate. You can do this using dimensional analysis or by the formula already included in the spreadsheet.
Try your hand at solving the problem using dimensional analysis. Click on the accordion arrow to see the answer once you have completed your work.
Mass Flow Rate from Volumetric Flow Rate (answer)
\[\frac{10000\ \text{L}}{\text{hr}}\times\frac{1\ \text{hr}}{3600\ \text{s}}\times\frac{0.91701\ \rm{g}}{\rm{mL}}\times\frac{1\ \rm{kg}}{1000\ \rm{g}}\times\frac{1000\ \rm{mL}}{1\ \rm{L}}=2.54725\ \frac{\rm{kg}}{\rm{s}}\]
To find the water density, click on the tab for the Water Properties Table and pick the density that is closest to the temperature input (keep in mind that the fluid cools by the time it reaches the surface). (Assume water is in the liquid state – no vapor phase present.) Place the number for the density in the Water Density value cell. Once you enter the density, the Injection Flowrate – Mass cell will update and the value will be shown in kg/s.
4) Next, we need to find what percentage of thermal energy can be converted to electrical energy for this particular project. Go to the third tab on the spreadsheet, Efficiency Estimate Plots, to find a reasonable estimate for the conversion efficiency.
Tip: use dashed orange lines to pick either a high, a medium or a low efficiency at the temperature of interest. See how your pick changes the results.
Enter the conversion efficiency value in the value cell for Geothermal powerplant efficiency, located on the Calculation Worksheet.
5) Find the specific enthalpy of water at the surface temperature from the Water Properties Table (second tab). This value will give us the energy the water is carrying per unit mass. (Assume water is in the liquid state – no vapor phase present.) Enter this value in the cell for Enthalpy.
6) According to ERCOT, 1 MW of electricity can power about 200 Texas homes during periods of peak demand. The Expected Electrical Power output of the plant is automatically calculated and displayed (in MW) and the Number of Powered Homes from this output is calculated and displayed.
How many homes can this Binary Cycle Power Plant provide electricity for during peak power demand?
Congratulations!
Using a simple set of calculations, you were able to estimate the potential of a geothermal resource/power plant to power homes in Texas at peak demand.

Image Credits
- Binary-cycle-plant-GeoVision-2.8: DOE, GeoVision
- Geothermal-Earth-plus-Heat-EERE: EERE, Geothermal Technologies Office